Has Consumption Inequality Increased With Income Inequality?
Why income and wealth are poor proxies for the real thing

As is well-known, income and wealth inequality has greatly increased since at least the 1980s. There is some argument about the exact slope and whether inequality was much higher before the Second World War, but no one seriously denies that there has been an increase in inequality. However, it is not necessarily the case that inequality in what we actually consume should track differences in wealth or income.
The first and obvious reason is in comparing differences in pre-tax income to consumption, which is always post-tax. This might seem like an obvious thing to adjust for, but this is not done surprisingly frequently. All of this matters because, fundamentally, only consumption inequality matters. Income inequality matters only insofar as it correlates with differences in resources available to consumption. If we are calling for redistribution to equalize incomes, it would not do to overlook what we do now to equalize them! For example, simply adding in food stamps is enough to substantially reduce differences in food purchases. This will show up in consumption, but need not show up in income.
The first serious reason why consumption inequality might not match income inequality is that people’s position in the hierarchy of income is not constant. An increase in income inequality, if paired with greater volatility in income over time, need not lead to any increase in lifetime income. Likewise with wealth. If people have expanded access to credit they will go into greater debt while young and consume more when older. Wealth is simply a proxy for lifetime consumption, which will break if we allow for different levels of borrowing.
There is an idea called the “permanent income hypothesis”. If consumption has declining marginal returns – and it must, for us to care at all about distribution – then we would want to evenly divide out consumption evenly throughout our lives, which we might call the “strong” permanent income hypothesis. We have both uncertainty about our lifetime income, and imperfect borrowing capacity, but the “weak” permanent income hypothesis surely holds, which is that people will borrow at the beginning of their lives and it back later in their life.
Not taking this into account leads one into errors like thinking that the bottom half are doing better in China than in the United States, as viral tweets periodically claim. It is indeed true that the average wealth of the bottom 50% of households is lower in America than in China, but that is precisely what you would expect to happen if you throw in lawyers and doctors in training with quite negative levels of wealth against poor households who also do not go into debt at any point in their life.
Second, if preferences are non-homothetic, then the mapping from income to utility is broken. (Non-homothetic preferences mean that the proportions of different goods that we consume changes when income changes.) Suppose that there exist free goods, of which people consume a fixed quantity. You can interpret this as “clean air” or “the internet” or any other free good of choice. As more of our consumption is composed of the free good, consumption inequality mechanically falls.
A related line of literature is on inflation inequality. With more information about the differences in consumer preferences across the income spectrum, we can compute the differences in changes in the prices of the goods which we consume. Jaravel (2019) shows that increasing income inequality led to differences in the discovery of new products catering toward higher income consumers. While Ezra Oberfield cautions that we cannot interpret inflation inequality as necessarily meaning that consumption inequality increased – it is possible for the price of goods to fall before poor consumers start buying it, and thus their prices never change while they are consuming it – Jaravel and Lashkari (2024) take that into account, and show that the relationship holds up.
Third, consumption and income may both be mismeasured. This cannot, in itself, tell us what the truth is. There have been several papers, however, proposing corrections for mismeasurement, and these do tend to change the headline results.
So what does the evidence say? This has been historically difficult to measure, as consumption has been less well-reported in U.S. national statistics than income has been. The first paper, to my knowledge, to seriously disentangle consumption and income inequality is Krueger and Perri (2006), who use the Consumer Expenditure Survey. The CEX is a large cross-sectional survey – it does not follow the same people over time – but it contains both income and expenditures going back to the 1980s. They found that while income inequality had increased by 20% during that time, consumption inequality had increased by only two percent. The variance of income changed, while the variance of consumption decreased. Panel data, like the PSID, did not track consumption data seriously until 1999. Attanasio and Pistaferri (2014) impute past consumption from the newly observed data, and argue that consumption inequality grew by more than Krueger and Perri believe.
Aguiar and Bils (2015) disagree with KP, and believe that the results are driven by measurement error. The big problem is that the implied savings rates don’t line up. At some point, the poor will run out of money, and the rich will decide to spend it. They correct for this, first by putting a constraint on how much people could actually be spending, and second by estimating elasticities with respect to income and seeing how well it predicts expenditure in future periods. (A similar trick is used in Bils and Klenow (2003)).
Meyer and Sullivan (2022) also believe that there is mismeasurement, but in the opposite direction. Their first proposed correction is to compare only at the 90th, 50th, and 10th percentile. They argue that income inequality in the tails is likely to be worse affected by spurious or false answers than those in the middle, while still covering the same points. They then use only the well-measured bits. Relative to Aguiar and Bils, dropping the small and presumably poorly-measured parts which don’t fit their structural assumptions greatly reduces the changes in consumption inequality.
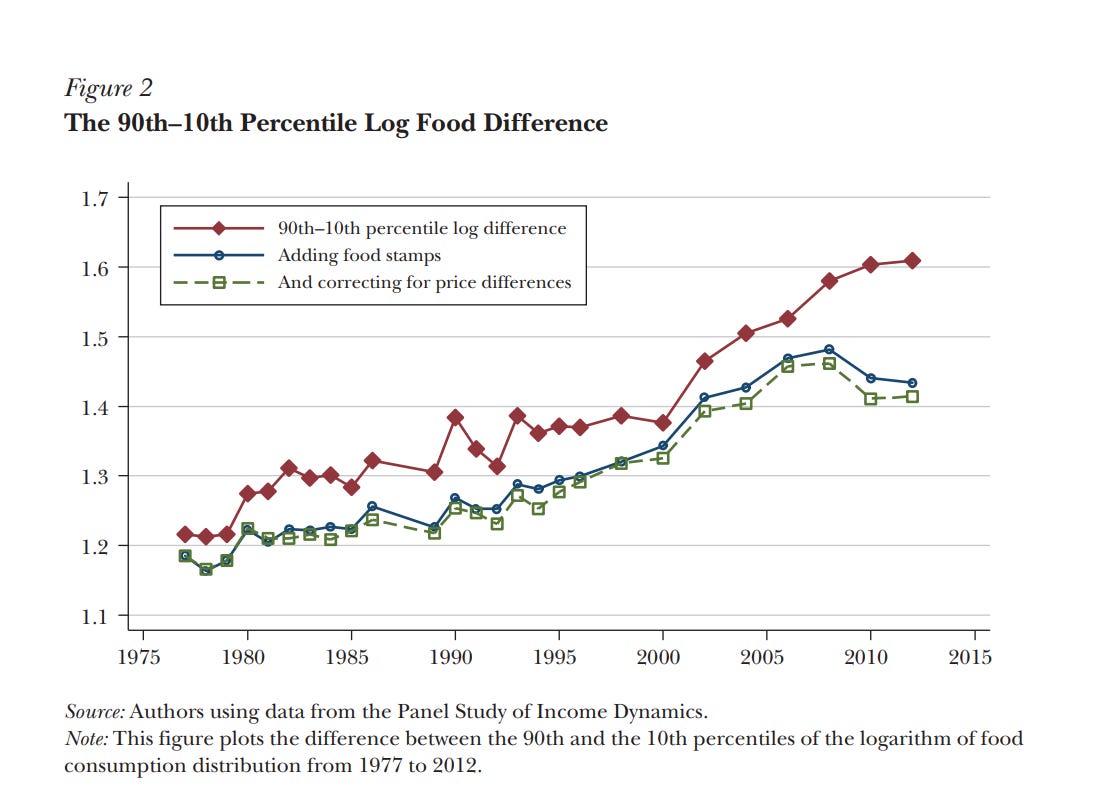
The competing views are well summarized by an article by Attanasio and Pistaferri (2016), which also has excellent graphs, as below.
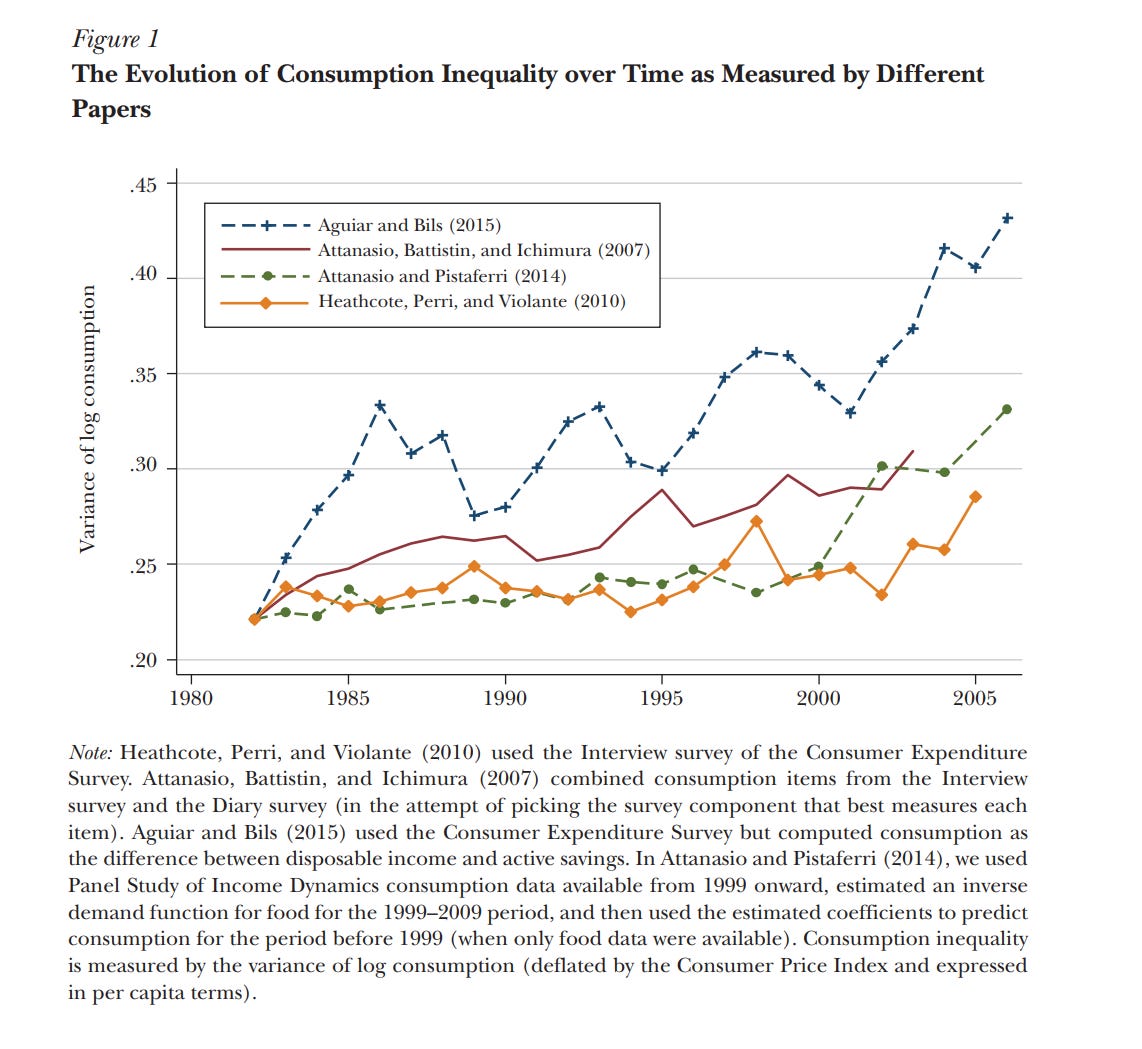
I do not know who comes out ahead in this debate. I came in without an answer, and left without one. I tend to think that consumption inequality is lower than would be apparent from income, especially as the point about public goods was never addressed (although this need not always reduce inequality if there is sufficient spatial sorting, and the free goods are local). Aguiar and Bils seems interesting, but is probably greatly overestimating consumption inequality over time.
What I think it really highlights is just how important data is. We have political programs proposed which, over the course of their life, would redistribute trillions of dollars. We would surely like to be extremely sure over some very basic facts about income and consumption in America. Yet, we are not. Surely we can do better?
"It is indeed true that the average wealth of the bottom 50% of households is lower in America than in China..."
Also important to note here that pretty much everywhere, average wealth for the bottom 50% is negligible relative to lifetime consumption. For example, this chart from (ugh) Reddit, we see that the bottom 50% has an average net worth of 3200 Euros in the US vs. 6500 in China (in PPP terms).
https://old.reddit.com/r/economy/comments/1lc8k2p/the_bottom_50_in_china_has_double_the_average_net/
The feeble-minded Redditor looks at this and thinks it means that the bottom half in China is twice as materially well off as the bottom half in the US. As you point out, young doctors and lawyers with six-figure debts are mathematically cancelling out a lot of savings in the bottom 50%, but even if we ignore that, a lump sum of 3300 Euros has a negligible impact on material standard of living relative to the much greater gap in real consumption between the bottom 50% in the US and China.
People want to treat net worth as a robust single measure of material standard of living, and it just isn't. A US citizen with a 25th-percentile income could easily save more than that in a matter of months by lowering his material standard of living to the level of a 25th-percentile. Chinese person.
By the way, have you seen the claim by Mark Zandi at Moody's that the top 10% of households now account for 50% of PCE? This is way off estimates based on CEX data, and I'm pretty sure it's wrong, but his team's methodology looks too complicated to reproduce just for a blog post, so I haven't been able to figure out what explains the discrepancy.